はじめに
こんにちはsuzukiです。今回はMPAndroidChartを使いボリンジャーバンドの描画に挑戦します。
前回記事で移動平均線を描画する際に少し詳しくMPAndroidChartライブラリの説明をしています。よければご覧ください。
ボリンジャーバンドとは
ボリンジャーバンドはローソク足を分析する際の手法です。詳しい内容自体はリンクを参照ください。
今回プログラムでは下記の三点と一部のデータだけ画面に表示するということを行っていきたいと思います。
- 標準偏差σを求める
- 移動平均線に±σを行いグラフのデータを作成する
- CombineChartで描画を行う
ライブラリの導入
build.gradle(Project)
| 1 2 3 | repositories { maven { url 'https://jitpack.io' } } |
build.gradle(Module)
| 1 2 3 | dependencies { implementation 'com.github.PhilJay:MPAndroidChart:v3.1.0-alpha' } |
上記を追加してgradleのSyncを行いましょう。
描画の準備
次にLayoutFileでチャートの描画範囲を決めましょう。
- CombinedChartを追加
- 上下左右に制約を追加
| 1 2 3 4 5 6 7 8 9 10 11 12 13 14 15 16 17 18 19 20 | <?xml version="1.0" encoding="utf-8"?> <android.support.constraint.ConstraintLayout xmlns:android="http://schemas.android.com/apk/res/android" xmlns:tools="http://schemas.android.com/tools" xmlns:app="http://schemas.android.com/apk/res-auto" android:layout_width="match_parent" android:layout_height="match_parent" tools:context=".MainActivity"> <com.github.mikephil.charting.charts.CombinedChart android:id="@+id/combinedChart" android:layout_width="0dp" android:layout_height="0dp" app:layout_constraintStart_toStartOf="parent" app:layout_constraintEnd_toEndOf="parent" app:layout_constraintBottom_toBottomOf="parent" app:layout_constraintTop_toTopOf="parent" /> </android.support.constraint.ConstraintLayout> |
ボリンジャーバンドを描画する
それでは実際にボリンジャーバンドを描画しましょう。
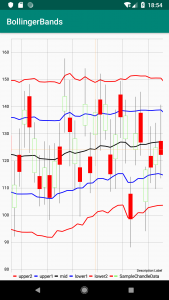
完成予定

CombinedChartの設定
combineChartの設定は、新たにデータ数を増やす影響もありX軸の表示数に制限を行います。
combinedChart.setVisibleXRangeMinimum(5.0f)
combinedChart.setVisibleXRangeMaximum(30.0f)
またスワイプの動作を行うためdragEnabledをtrueに変更します
isDragEnabled = true
| 1 2 3 4 5 6 7 8 9 10 11 12 13 14 15 16 17 18 19 20 21 22 23 24 25 26 27 28 29 30 31 32 33 34 35 36 37 38 39 40 41 42 43 44 45 46 | // 複合チャートの描画 private fun setupCombinedChart(combinedChart: CombinedChart, data: CombinedData) { combinedChart.apply { setOnChartValueSelectedListener(this@MainActivity) //タッチ検出 setTouchEnabled(true) //ドラッグの有効化 isDragEnabled = true isScaleXEnabled = true description.isEnabled = true setPinchZoom(false) setDrawGridBackground(false) //データラベルの表示 legend.apply { form = Legend.LegendForm.LINE typeface = mTypeface textSize = 11f textColor = Color.BLACK verticalAlignment = Legend.LegendVerticalAlignment.BOTTOM horizontalAlignment = Legend.LegendHorizontalAlignment.LEFT orientation = Legend.LegendOrientation.HORIZONTAL setDrawInside(false) } //y軸右側の表示 axisRight.isEnabled = false //X軸表示 xAxis.apply { typeface = mTypeface setDrawLabels(false) setDrawGridLines(true) } //y軸左側の表示 axisLeft.apply { typeface = mTypeface textColor = Color.BLACK setDrawGridLines(true) } setData(data) setVisibleXRangeMaximum(30.0f) setVisibleXRangeMinimum(5.0f) } } |
CombinedChart用のデータ作成
ボリンジャーバンドを作成するためのデータを作成します。
ローソク足用のデータは移動平均線と同様の作成方法を行い
下記のendPointsに終値のデータを保持します。
private var endPoints = mutableListOf
移動平均線は5日としてデータ作成したのですが、ボリンジャーバンドは期間が20or25と書いてあったため下記を宣言します。
private val periodCount = 20
| 1 2 3 4 5 6 7 8 9 10 11 12 13 14 15 16 17 18 19 20 21 22 23 24 25 26 27 28 29 30 31 32 33 34 35 36 37 38 | private fun generateCandleData(count: Int, range: Float): CandleData { val values = mutableListOf<CandleEntry>() endPoints = mutableListOf() for (i in 0 until count) { val multi = (range + 1) val value = (Math.random() * 40).toFloat() + multi val high = (Math.random() * 9).toFloat() + 8f val low = (Math.random() * 9).toFloat() + 8f val open = (Math.random() * 6).toFloat() + 1f val close = (Math.random() * 6).toFloat() + 1f val even = i % 2 == 0 endPoints.add(if (even) value - close else value + close) values.add( CandleEntry( i.toFloat() + 0.5f, value + high, value - low, if (even) value + open else value - open, if (even) value - close else value + close ) ) } return CandleData(CandleDataSet(values, "SampleChandleData").apply { axisDependency = YAxis.AxisDependency.LEFT shadowColor = Color.DKGRAY shadowWidth = 0.7f //アイコン描画 setDrawIcons(false) //color for open < close decreasingColor = Color.RED decreasingPaintStyle = Paint.Style.FILL //color for open > close increasingColor = Color.rgb(122, 242, 84) increasingPaintStyle = Paint.Style.STROKE neutralColor = Color.BLUE }) } |
続いてボリンジャーバンド用のデータです。
移動平均線は一つの折れ線でしたがボリンジャーバンドは下記の5つの折れ線です。
- アッパーバンド2:単純移動平均線+2標準偏差(σ)
- アッパーバンド1:単純移動平均線+1標準偏差(σ)
- ミッドバンド:単純移動平均線
- ロワーバンド1:単純移動平均線-1標準偏差(σ)
- ロワーバンド2:単純移動平均線-2標準偏差(σ)
前回と同じようなコードだととても縦長になってしまうため。下記の関数を作成します。
| 1 2 3 4 5 6 7 8 9 10 11 | ///Entry,ラベルの文字列、線の色を受け取り LineDataSetを返却する関数 private fun createLineDataSet(chartData: MutableList<Entry>, label: String, color: Int): LineDataSet { return LineDataSet(chartData, label).apply { lineWidth = 2f setDrawValues(false) axisDependency = YAxis.AxisDependency.LEFT this.color = color setDrawCircles(false) setDrawCircleHole(false) } } |
続いてendPointからボリンジャーバンド用にデータを作成します。
引数でendPointsを明示的に渡すようにしました。
sliceでarrayを作ったのでそのまま書いていますが、標準偏差sigmaを求める関数作った方がシンプルに見えるかもしれません。
| 1 2 3 4 5 6 7 8 9 10 11 12 13 14 15 16 17 18 19 20 21 22 23 24 25 26 27 28 29 30 31 32 33 34 35 36 37 38 39 40 41 42 43 44 45 46 | private fun bolingerBandData(endPoints: MutableList<Float>): LineData { //アッパーバンド2=単純移動平均線+2標準偏差(σ) val upperBand2Entry = mutableListOf<Entry>() //アッパーバンド1=単純移動平均線+1標準偏差(σ) val upperBand1Entry = mutableListOf<Entry>() //ミッドバンド=単純移動平均線 val midBandEntry = mutableListOf<Entry>() //ロワーバンド1=単純移動平均線-1標準偏差(σ) val lowerBand1Entry = mutableListOf<Entry>() //ロワーバンド2=単純移動平均線-2標準偏差(σ) val lowerBand2Entry = mutableListOf<Entry>() endPoints.forEachIndexed { index, _ -> if (index >= periodCount - 1) { //期間中のデータ val array = endPoints.slice(index - (periodCount - 1)..index) //単純移動平均線用のデータ val value = array.reduce { acc, fl -> acc + fl } / periodCount ///標準偏差用の計算式 //期間毎価格の合計の二乗の合計 val left = array.map { it.pow(2) }.reduce { acc, fl -> acc + fl } * periodCount //価格の合計の自乗 val right = array.reduce { acc, fl -> acc + fl }.pow(2) //期間*(期間-1) val under = periodCount * (periodCount - 1) //標準偏差 val sigma = sqrt((left - right) / under) upperBand2Entry.add(Entry(index.toFloat() + 0.5f, value + (sigma * 2))) upperBand1Entry.add(Entry(index.toFloat() + 0.5f, value + (sigma))) midBandEntry.add(Entry(index.toFloat() + 0.5f, value)) lowerBand1Entry.add(Entry(index.toFloat(), value - (sigma))) lowerBand2Entry.add(Entry(index.toFloat(), value - (sigma * 2))) } } return LineData( listOf( createLineDataSet(upperBand2Entry, "upper2", Color.RED), createLineDataSet(upperBand1Entry, "upper1", Color.BLUE), createLineDataSet(midBandEntry, "mid", Color.BLACK), createLineDataSet(lowerBand1Entry, "lower1", Color.BLUE), createLineDataSet(lowerBand2Entry, "lower2", Color.RED) ) ) } |
CombinedChartに描画
ローソク足の個数はとりあえず200で描画しています。
| 1 2 3 4 5 6 7 8 9 10 11 12 13 14 15 16 | private var mTypeface = Typeface.create(Typeface.SANS_SERIF, Typeface.NORMAL) private var endPoints = mutableListOf<Float>() private val chartDataCount = 200 //幾つのデータの平均値を取得するか private val periodCount = 20 override fun onCreate(savedInstanceState: Bundle?) { super.onCreate(savedInstanceState) setContentView(R.layout.activity_main) val combineData = CombinedData() combineData.setData(generateCandleData(chartDataCount, 100f)) combineData.setData(bolingerBandData(endPoints)) setupCombinedChart(combinedChart, combineData) } |
さいごに
AndroidStudioのcommand + option + l がとても便利ですね。ブログではコード量少ないため気にならないですが、参照されていない変数がわかるのも気に入っております。XCodeが一番使っているIDEなので使い慣れていますが、AndroidStudioも使いこなして生産性あげて行きたいです。


