
はじめに
こんにちは、suzukiです。前回の記事に続きKotlinでMPAndroidChartライブラリを使い移動平均線を描画します。
Kolinはまだまだ勉強中なので練習として作成しました。
MPAndroidChartライブラリについて
今回KotlinでMPAndroidChartを利用してチャートを書きます。
Androidのサンプルはストアからダウンロードが可能です。
ライブラリの導入
Androidは追加方法がシンプルでいいですね。
build.gradle(Project)
| 1 2 3 | repositories { maven { url 'https://jitpack.io' } } |
build.gradle(Module)
| 1 2 3 | dependencies { implementation 'com.github.PhilJay:MPAndroidChart:v3.1.0-alpha' } |
上記を追加してgradleのSyncを行えばライブラリの準備が整います。
描画の準備
次にXMLでレイアウトを作成します。
今回はSwift同様に画面いっぱいに3つのチャートを配置していきます。
こちらの記事を参考に作成しました。
| 1 2 3 4 5 6 7 8 9 10 11 12 13 14 15 16 17 18 19 20 21 22 23 24 25 26 27 28 29 30 31 32 33 34 35 36 37 38 39 40 41 | <?xml version="1.0" encoding="utf-8"?> <android.support.constraint.ConstraintLayout xmlns:android="http://schemas.android.com/apk/res/android" xmlns:tools="http://schemas.android.com/tools" xmlns:app="http://schemas.android.com/apk/res-auto" android:layout_width="match_parent" android:layout_height="match_parent" tools:context=".MainActivity"> <com.github.mikephil.charting.charts.LineChart android:id="@+id/lineChart" android:layout_width="0dp" android:layout_height="0dp" app:layout_constraintStart_toStartOf="parent" app:layout_constraintEnd_toEndOf="parent" app:layout_constraintTop_toTopOf="parent" app:layout_constraintBottom_toTopOf="@id/candleStickChart" app:layout_constraintVertical_chainStyle="spread" /> <com.github.mikephil.charting.charts.CandleStickChart android:id="@+id/candleStickChart" android:layout_width="0dp" android:layout_height="0dp" app:layout_constraintStart_toStartOf="parent" app:layout_constraintEnd_toEndOf="parent" app:layout_constraintTop_toBottomOf="@id/lineChart" app:layout_constraintBottom_toTopOf="@id/combinedChart" app:layout_constraintVertical_chainStyle="spread" /> <com.github.mikephil.charting.charts.CombinedChart android:id="@+id/combinedChart" android:layout_width="0dp" android:layout_height="0dp" app:layout_constraintStart_toStartOf="parent" app:layout_constraintEnd_toEndOf="parent" app:layout_constraintTop_toBottomOf="@id/candleStickChart" app:layout_constraintBottom_toBottomOf="parent" app:layout_constraintVertical_chainStyle="spread" /> </android.support.constraint.ConstraintLayout> |
- LineChart CandleStickChart CombinedChartを追加
- 上下左右に制約を追加
- 三つのChartの高さを等しく

折れ線グラフを描画する
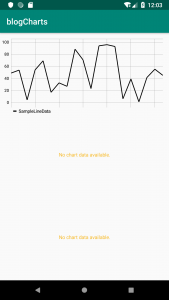
シンプルな折れ線グラフを描画しようと思います。
完成予定
LineChartの設定
LineChartに設定できる内容はたくさんあります。
今回は画像のようなシンプルな線グラフを表示します。
数値などの文字にフォントが設定する内容を先に記述します(ご指摘いただきありがとうございます。)
| 1 2 3 4 | //Typefaceの設定、後ほど使用します。 private var mTypeface = Typeface.create(Typeface.SANS_SERIF, Typeface.NORMAL) override fun onCreate(savedInstanceState: Bundle?) { |
apply便利ですね。
| 1 2 3 4 5 6 7 8 9 10 11 12 13 14 15 16 17 18 19 20 21 22 23 24 25 26 27 28 29 30 31 32 33 34 35 36 37 38 39 40 | private fun setupLineChart(){ lineChart.apply { setOnChartValueSelectedListener(this@MainActivity) description.isEnabled = false setTouchEnabled(true) isDragEnabled = true isScaleXEnabled = true setPinchZoom(false) setDrawGridBackground(false) //データラベルの表示 legend.apply { form = Legend.LegendForm.LINE typeface = mTypeface textSize = 11f textColor = Color.BLACK verticalAlignment = Legend.LegendVerticalAlignment.BOTTOM horizontalAlignment = Legend.LegendHorizontalAlignment.LEFT orientation = Legend.LegendOrientation.HORIZONTAL setDrawInside(false) } //y軸右側の表示 axisRight.isEnabled = false //X軸表示 xAxis.apply { typeface = mTypeface setDrawLabels(false) setDrawGridLines(true) } //y軸左側の表示 axisLeft.apply { typeface = mTypeface textColor = Color.BLACK setDrawGridLines(true) } } } |
チャートのタップ時のリスナーを受け取るために下記を記述します。
| 1 2 | //OnChartValueSelectedListenerリスナを登録する準備 class MainActivity : AppCompatActivity(),OnChartValueSelectedListener |
| 1 2 3 4 5 6 7 | override fun onValueSelected(e: Entry, h: Highlight) { Log.i("Entry selected", e.toString()) } override fun onNothingSelected() { Log.i("Nothing selected", "Nothing selected.") } |
LineChart用のデータ作成
グラフ用のデータはサンプルを参考に + Swiftと同じ様に作っています。
| 1 2 3 4 5 6 7 8 9 10 11 12 13 14 15 16 17 18 19 20 21 22 23 24 | // LineChart用のデータ作成 private fun lineDataWithCount(count: Int, range: Float):LineData { val values = mutableListOf<Entry>() for (i in 0 until count) { val value = (Math.random() * (range)).toFloat() values.add(Entry(i.toFloat(), value)) } // create a dataset and give it a type val yVals = LineDataSet(values, "SampleLineData").apply { axisDependency = YAxis.AxisDependency.LEFT color = Color.BLACK highLightColor = Color.YELLOW setDrawCircles(false) setDrawCircleHole(false) setDrawValues(false) lineWidth = 2f } val data = LineData(yVals) data.setValueTextColor(Color.BLACK) data.setValueTextSize(9f) return data } |
LineChartに描画
先ほどの二つの関数を使い折れ線を描画します。
| 1 2 3 4 5 6 7 8 9 | private val chartDataCount = 20 override fun onCreate(savedInstanceState: Bundle?) { super.onCreate(savedInstanceState) setContentView(R.layout.activity_main) setupLineChart() lineChart.data = lineDataWithCount(chartDataCount, 100f) } |
折れ線グラフの描画が完了しました。
sampleがKotlinではないので置き換えるの苦労しました。
getterとsetterがあるとSwiftのプロパティのように記述できます。
setDrawCircles(false)と記述しているのは、DrawCirclesのgetterがisDrawCirclesEnabledと定義されており、制約に合わないためです。
ローソク足を描画する
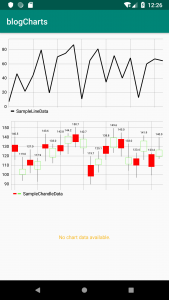
次にローソク足の描画を行います。
完成予定
CandleStickChartの設定
CandleStickChartでは下記のような設定を行います。
LineChertとほとんど一緒です。Kotlin使っているのでXMLのIDでインスタンスが取得できるの便利ですね。
| 1 2 3 4 5 6 7 8 9 10 11 12 13 14 15 16 17 18 19 20 21 22 23 24 25 26 27 28 29 30 31 32 33 34 35 36 37 38 39 40 41 | // ローソク足のチャートの設定 private fun setupCandleStickChart(){ candleStickChart.apply { setOnChartValueSelectedListener(this@MainActivity) description.isEnabled = false setTouchEnabled(true) isDragEnabled = true isScaleXEnabled = true setPinchZoom(false) setDrawGridBackground(false) //データラベルの表示 legend.apply { form = Legend.LegendForm.LINE typeface = mTypeface textSize = 11f textColor = Color.BLACK verticalAlignment = Legend.LegendVerticalAlignment.BOTTOM horizontalAlignment = Legend.LegendHorizontalAlignment.LEFT orientation = Legend.LegendOrientation.HORIZONTAL setDrawInside(false) } //y軸右側の表示 axisRight.isEnabled = false //X軸表示 xAxis.apply { typeface = mTypeface setDrawLabels(false) setDrawGridLines(true) } //y軸左側の表示 axisLeft.apply { typeface = mTypeface textColor = Color.BLACK setDrawGridLines(true) } } } |
CandleStickChart用のデータ作成
| 1 2 3 4 5 6 7 8 9 10 11 12 13 14 15 16 17 18 19 20 21 22 23 24 25 26 27 28 29 30 31 32 33 34 35 36 37 38 39 40 41 42 | // ローソク足用のデータの取得 private fun candleDataWithCount(count: Int, range: Float):CandleData{ var values = mutableListOf<CandleEntry>() for (i in 0 until count) { val multi = (range + 1) val value = (Math.random() * 40).toFloat() + multi val high = (Math.random() * 9).toFloat() + 8f val low = (Math.random() * 9).toFloat() + 8f val open = (Math.random() * 6).toFloat() + 1f val close = (Math.random() * 6).toFloat() + 1f val even = i % 2 == 0 values.add( CandleEntry( i.toFloat(), value + high, value - low, if (even) value + open else value - open, if (even) value - close else value + close ) ) } val set = CandleDataSet(values, "SampleChandleData").apply { axisDependency = YAxis.AxisDependency.LEFT shadowColor = Color.DKGRAY shadowWidth = 0.7f //アイコン描画 setDrawIcons(false) //color for open < close decreasingColor = Color.RED decreasingPaintStyle = Paint.Style.FILL //color for open > close increasingColor = Color.rgb(122, 242, 84) increasingPaintStyle = Paint.Style.STROKE neutralColor = Color.BLUE } return CandleData(set) } |
CandleStickChartに描画
先ほど同様にonCreateにローソク足用のデータを追加しました。
| 1 2 3 4 5 6 7 8 9 10 11 12 | private val chartDataCount = 20 override fun onCreate(savedInstanceState: Bundle?) { super.onCreate(savedInstanceState) setContentView(R.layout.activity_main) setupLineChart() lineChart.data = lineDataWithCount(chartDataCount, 100f) //こちらを追加 setupCandleStickChart() candleStickChart.data = candleDataWithCount(chartDataCount,100f) } |
Combined-Chartにローソク足と移動平均線を描画
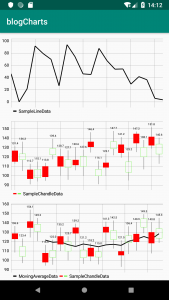
それでは最後に複合グラフを描画します。
Swiftと違いバグなく実装できました。
完成予定
CombinedChartの設定
下記の設定を行います。
表示領域を少し調整する必要がありました。
キャンドル用のデータを何も考えずに描画すると最初と最後が見切れてしまいます。
今回は最大を20fと最小を0fと設定しています。入力されるデータ数を参照して調整できるように変更したほうがいいかもしれません。
| 1 2 3 4 5 6 7 8 9 10 11 12 13 14 15 16 17 18 19 20 21 22 23 24 25 26 27 28 29 30 31 32 33 34 35 36 37 38 39 40 41 42 43 | // 複合チャートの描画 private fun setupCombinedChart(){ combinedChart.apply { setOnChartValueSelectedListener(this@MainActivity) description.isEnabled = false setTouchEnabled(true) isDragEnabled = true isScaleXEnabled = true setPinchZoom(false) setDrawGridBackground(false) //データラベルの表示 legend.apply { form = Legend.LegendForm.LINE typeface = mTypeface textSize = 11f textColor = Color.BLACK verticalAlignment = Legend.LegendVerticalAlignment.BOTTOM horizontalAlignment = Legend.LegendHorizontalAlignment.LEFT orientation = Legend.LegendOrientation.HORIZONTAL setDrawInside(false) } //y軸右側の表示 axisRight.isEnabled = false //X軸表示 xAxis.apply { typeface = mTypeface //表示領域の調整 axisMinimum = 0f axisMaximum = 20f setDrawLabels(false) setDrawGridLines(true) } //y軸左側の表示 axisLeft.apply { typeface = mTypeface textColor = Color.BLACK setDrawGridLines(true) } } } |
CombinedChart用のデータ作成
移動平均線用の計算ロジックを組み込みます。
private var endPoints = mutableListOf
を宣言します。
宣言したendPointsにキャンドルデータの作成のロジック部分で終値を保存します。
| 1 2 3 4 5 6 7 8 9 10 11 12 13 14 15 16 17 18 19 20 21 22 23 24 25 26 27 28 29 30 31 32 33 34 35 36 37 38 39 | fun generateCandleData(count: Int, range: Float):CandleData{ val values = mutableListOf<CandleEntry>() endPoints = mutableListOf() for (i in 0 until count) { val multi = (range + 1) val value = (Math.random() * 40).toFloat() + multi val high = (Math.random() * 9).toFloat() + 8f val low = (Math.random() * 9).toFloat() + 8f val open = (Math.random() * 6).toFloat() + 1f val close = (Math.random() * 6).toFloat() + 1f val even = i % 2 == 0 endPoints.add(if (even) value - close else value + close) values.add( CandleEntry( i.toFloat() + 0.5f, value + high, value - low, if (even) value + open else value - open, if (even) value - close else value + close ) ) } val set1 = CandleDataSet(values, "SampleChandleData").apply { axisDependency = YAxis.AxisDependency.LEFT shadowColor = Color.DKGRAY shadowWidth = 0.7f //アイコン描画 setDrawIcons(false) //color for open < close decreasingColor = Color.RED decreasingPaintStyle = Paint.Style.FILL //color for open > close increasingColor = Color.rgb(122, 242, 84) increasingPaintStyle = Paint.Style.STROKE neutralColor = Color.BLUE } return CandleData(set1) } |
移動平均線は5つのデータ分の終値の平均でデータをもとに折れ線グラフを描画作成します。
| 1 2 3 4 5 6 7 8 9 10 11 12 13 14 15 16 17 18 19 20 21 22 23 24 25 | fun movingAverageData(): LineData{ //幾つのデータの平均値を取得するか val movingDataCount = 5 var movingLineChartData = mutableListOf<Entry>() endPoints.forEachIndexed { index, fl -> if (index >= movingDataCount -1) { val value = endPoints.slice(index - (movingDataCount - 1)..index).reduce { acc, fl -> acc + fl } / movingDataCount movingLineChartData.add(Entry(index.toFloat() + 0.5f, value)) } } val yVals = LineDataSet(movingLineChartData, "MovingAverageData").apply { lineWidth = 2f highLightColor = Color.YELLOW setDrawValues(false) axisDependency = YAxis.AxisDependency.LEFT color = Color.BLACK setDrawCircles(false) setDrawCircleHole(false) } val data = LineData(yVals) data.setValueTextColor(Color.BLACK) data.setValueTextSize(9f) return data } |
CombinedChartに描画
最後にonCreateでデータの値をセットします。
| 1 2 3 4 5 6 7 8 9 10 11 12 13 14 15 16 17 | override fun onCreate(savedInstanceState: Bundle?) { super.onCreate(savedInstanceState) setContentView(R.layout.activity_main) setupLineChart() lineChart.data = lineDataWithCount(chartDataCount,100f) setupCandleStickChart() candleStickChart.data = candleDataWithCount(chartDataCount,100f) //こちらを追加 setupCombinedChart() val combineData = CombinedData() combineData.setData(generateCandleData(chartDataCount, 100f)) combineData.setData(movingAverageData()) combinedChart.data = combineData } |
最後に
最後までありがとうございます。SwiftとKotlin両方で同じようなコードを書きました。
Kotlinの良さを最大限は引き出せていないかと思いますし、AndroidStudioに慣れてもおりません。
少しずつ慣れていこうと思いますので、またAndroidの記事もあげていきたいと思っております。
おすすめ書籍


mTypeface がエラーになります
ご指摘ありがとうございます。
宣言部分の表記もれでした。LineChartの設定の箇所に下記を追記させていただいております。
private var mTypeface = Typeface.create(Typeface.SANS_SERIF, Typeface.NORMAL)